This gallery shows a selection of data plots, images and animations produced by the SWATNet Early Stage Researchers.
Solar flux ropes
Magnetic flux ropes are key ingredients of coronal mass ejections – the main drivers of big space weather storms. Modelling of them is therefore in the centre of solar terrestrial studies, but finding them from coronal simulations is not an easy task. This animation shows a rising solar flux rope extracted from a data-driven lower coronal magnetofrictional simulation using a developed semi-automated identification algorithm for an eruption that occurred from active region 12473 on 28 December 2015. Flux ropes are structures where magnetic field lines wind about a common axis, in other words they have a high magnetic twist. The bottom of the simulation domain shows the evolving boundary condition that is the time series of solar surface magnetic fields taken by Solar Dynamics Observatory. (Andreas Wagner/Project 6)
Solar Energetic particles
Solar energetic particles (SEPs) consist of protons, ions, and electrons, accelerated by solar flares and at the frontal shock waves driven by fast coronal mass ejections (CMEs). Due to their potential threat to astronauts and spacecraft, there is particular interest in understanding the underlying physics behind their acceleration and transport.
SEPs are accelerated by the Diffusive Shock Acceleration (DSA) process. However, standard 1D DSA models often overlook adiabatic focusing effects from field gradients. This animation illustrates the evolution of particle momentum in a 1D Monte Carlo acceleration model, incorporating realistic mass density and magnetic field profiles from the COCONUT model (COolfluid COroNa UnsTructured) to include adiabatic focusing. Due to the adiabatic focusing, particles in the upstream region (pre-shock) can either be confined near the shock or allowed to escape, while downstream particles (Sunward of the shock) experience adiabatic cooling, causing a gradual decrease in momentum. This visualization highlights how magnetic field variations influence SEP transport and acceleration, emphasizing the crucial role of adiabatic focusing in SEP dynamics. (Lidiya Annie John / Project 7)
Physics-based models have proved to be valuable forecasting tools for SEPs. Numerical models often focus on modelling energetic particle transport in interplanetary space. Since CMEs evolve already in the lower corona, where SEPs are accelerated, it is crucial to study particle transport in the corona as well. These animations are based on the coronal magnetohydrodynamic (MHD) model COCONUT with the particle transport code PARADISE. COCONUT generates the background solar wind containing a CME that is modelled as a flux rope, featured as a bundle of twisted magnetic field lines with two footpoints on the Sun’s surface. Subsequently, particles are injected in one leg of the flux rope, close to its footpoint, and evolved them through the corona as the CME expanded. In the video on the top, the particle intensity contours are shown along with the flux rope CME, where no guiding centre drifts or perpendicular diffusion were included. The particles remain confined to the CME. In the right video, the same setup is used but perpendicular diffusion is included at a perpendicular to parallel mean free path ratio of 0.0005. Despite this small ratio, particles are able to escape the CME, primarily in CME propagation direction, but also somewhat longitudinally. (Edin Husidic / Project 8)
Features on the Sun
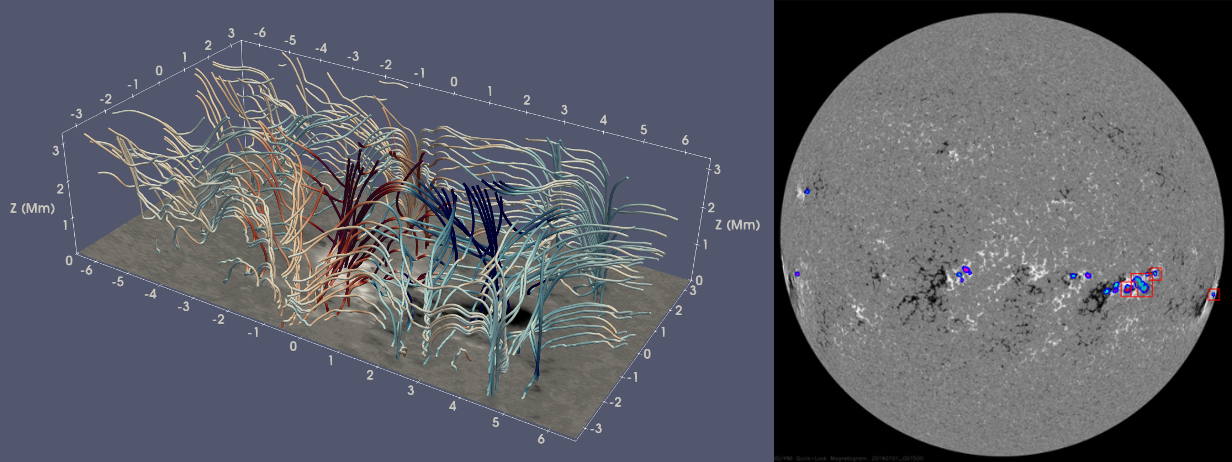
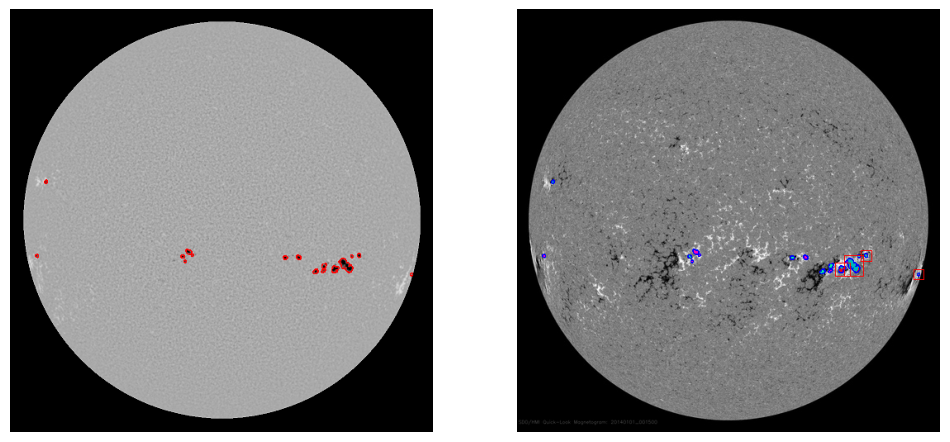
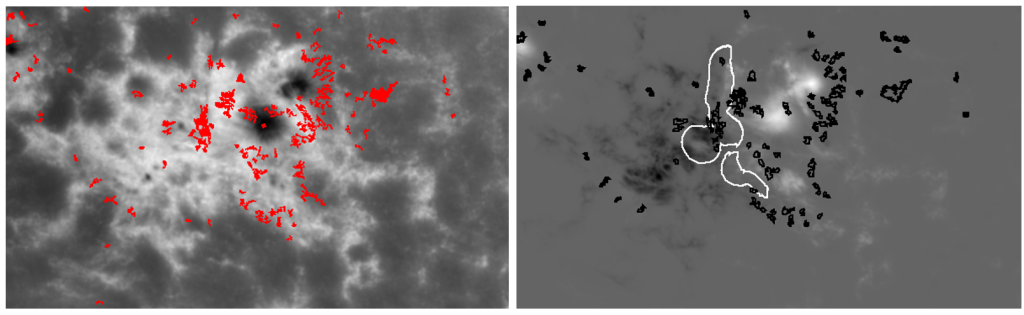
The most powerful solar flares come from complex sunspots called delta-sunspots. For a better understanding of their underlying physics an automated mathematical morphology detection method was developed that allows extensive statistical studies. The plot on left shows Solar Dynamics Observatory’s ultraviolet image on 1 January 2014. The identified sunspots are marked red in the plot. The figure on right shows the corresponding magnetogram with sunspot contours superimposed revealing their magnetic polarity. Inward directed magnetic fields are red and outward directed fields are turquoise. The red bounding boxes encompass sunspots with different magnetic polarities. (Slava Bourgeois/Project 12)Catching brightenings in our Sun is important for investigated the dynamics and configurations of the lower solar atmosphere. The background in the left figure shows the solar active region 11226 imaged at 1600 Ångström wavelength. This wavelength reveals the lower atmosphere of the Sun. The red pixels mark transient brightenings over one day period. The right figure shows the line-of-sight magnetic field at the solar surface for the same area. The black contours correspond to brightenings and the white contours the area where the direction of the magnetic field changes. (Augustin André-Hoffmann/Project 2)
Modelling of the solar atmosphere
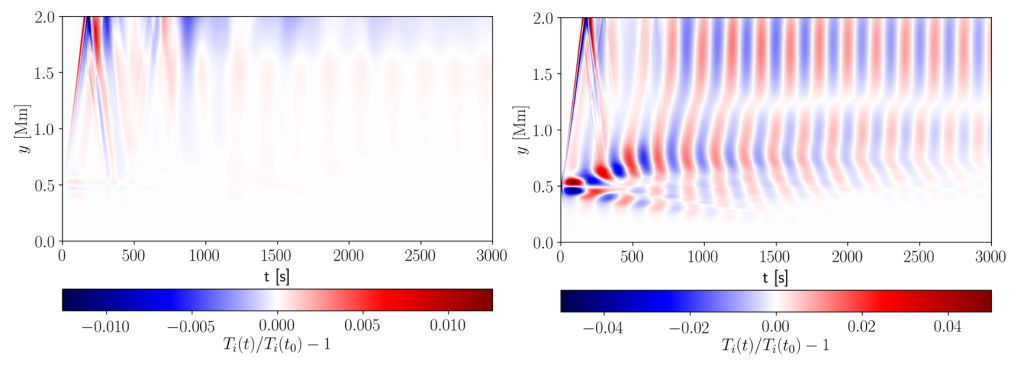
Why is the solar corona in millions of degrees of temperature? This question remains to puzzle the science community. These red and blue zebra-stripes show temperature perturbations in a lower coronal simulation. The left figure shows a simulation result where no waves are launched in the simulation. In this case temperature perturbations are very small. The right panel shows the result when coupled magneto-acoustic and Alfvén waves are introduced in the simulation. Now temperature perturbations are much larger. This demonstrates that the investigated waves can result in heating of the chromosphere, the atmospheric layer below the corona. (Mayank Kumar/Project 5)
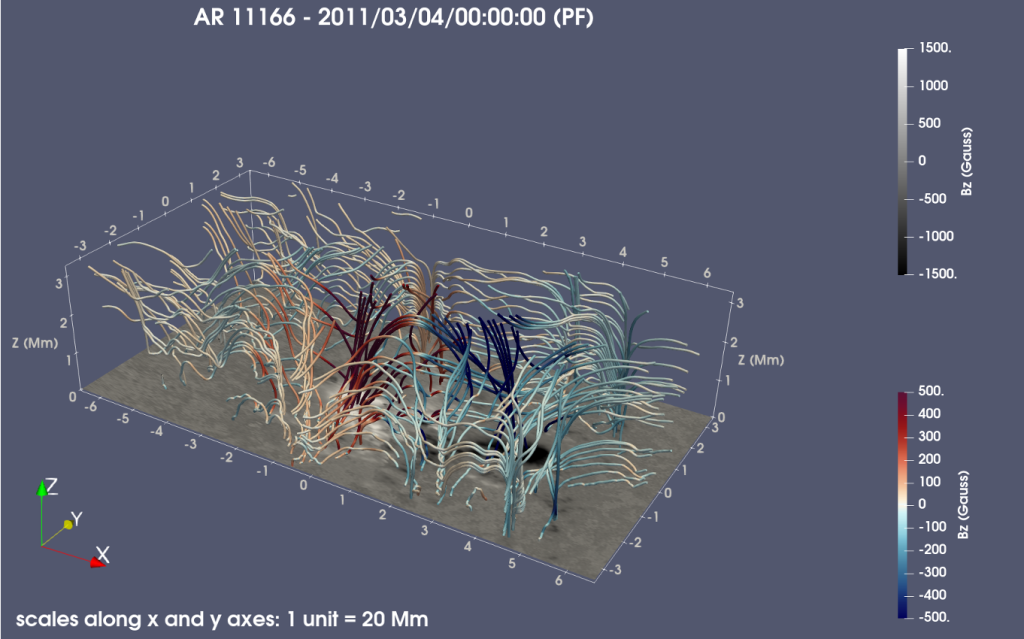
The modelling of the solar magnetic field is a key for our understanding of the Sun’s activity. This beautiful winding forest is a visualisation of the verticalmagnetic field in the lower solar atmosphere extrapolated from the maps of the magnetic field (magnetograms) obtained by Solar Dynamics Observatory. The event studied is an active region 11166 that was visible at the western limb of the Sun on 4 March 2011 (Shreeyesh Biswal/Project 3)
Forecasting
Probabilistic simulation of an active region evolution with generative AI. Such video predictions allow us to derive useful space weather quantities like Maximum Peak Flux, Time to Flare, Fluence, with uncertainty quantification thanks to the probabilistic nature of the model. This example use a 2 hour temporal resolution as a proof of concept, higher resolution will be necessary for operational applications . (Grégoire Francisco/ Project 10)